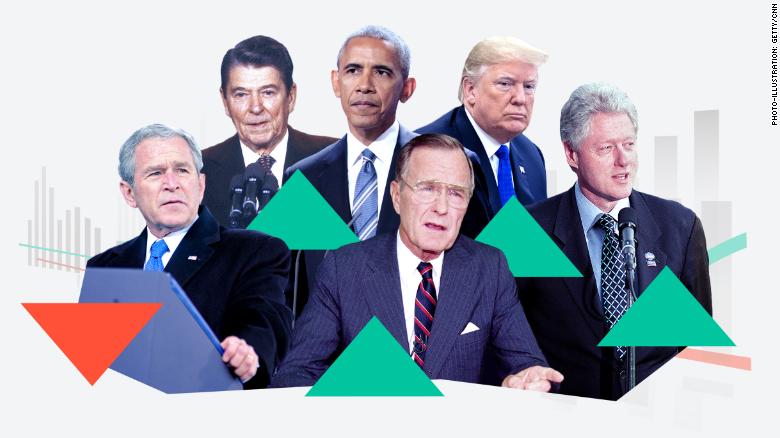
The stock market is certainly not the best indicator of the economy’s health, or of a president’s track record. But throughout his four years in office, it clearly was President Donald Trump’s favorite metric. He often tweeted in all caps about “ALL TIME HIGHS!!!” for stocks, even as the country grappled with surging coronavirus cases and high unemployment during the pandemic.
Now, as he wraps up his last day in the White House, where does Trump’s beloved stock market stand? As of Tuesday’s market close, the S&P 500 was up 67% since his Inauguration Day in 2017.
Here’s how that performance stacks up to stocks at the same point in other modern presidencies (1,006 trading days, to be exact): Stocks were up 83% at this point in Barack Obama’s presidency, amid the recovery from the Great Recession. They were much weaker under George W. Bush, down about 13% because of the September 11th attacks and the dot-com bust. Stocks were up 75% four years into Bill Clinton’s presidency, and 25% into Ronald Reagan’s.
Meanwhile, President George H.W. Bush, who also failed to win reelection, ended his four years with stocks up around 50%.
Unlike his predecessor, incoming President-elect Joe Biden does not put nearly as much emphasis on stocks as a gauge of the country’s strength or wellbeing.
“The idea that the stock market is booming is his only measure of what’s happening,” Biden said of Trump in the final presidential debate in October. “Where I come from in Scranton and Claymont, the people don’t live off of the stock market.”
S&P 500 in the first 1,006 trading days of each presidency
Diana Walker/Time Life Pictures/Getty Images
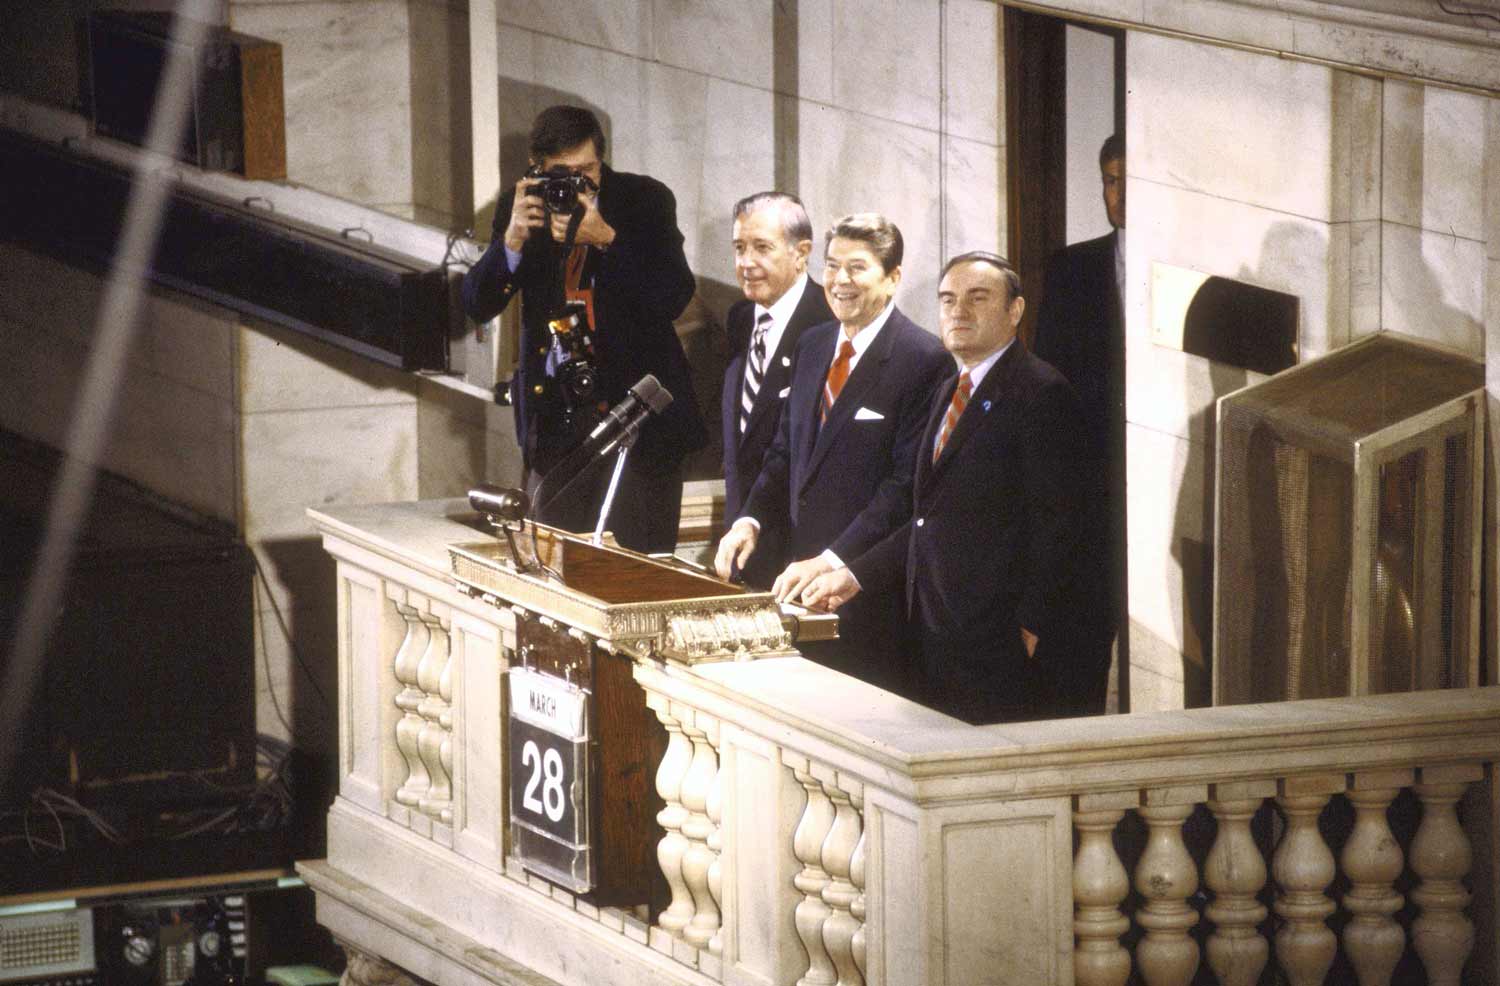
Ronald Reagan
President Ronald Reagan’s first four years in the White House weren’t particularly lucrative for Wall Street.
Crushed by Federal Reserve Chairman Paul Volcker’s war on inflation, the economy stumbled into a brief recession in July 1981. Unemployment spiked to nearly 11%.
But Volcker’s rate hikes and Reagan’s corporate tax cuts eventually broke the back of inflation, setting the stage for rapid economic growth. Under Reagan, America drastically ramped up defense spending in a successful bid to bring down the Soviet Union.
Despite the strong economy, Wall Street suffered its worst day ever under Reagan. The Dow plunged an astonishing 22.6% on Black Monday — equaling about 5,500 points today.
Nonetheless, the S&P 500 posted five separate years of double-digit growth on the Gipper’s watch, including a 26% spike in 1985.
1st term
+30%
Jan. 20, 1981 – Jan. 20, 1985
2nd term
+67%
Jan. 20, 1985 – Jan. 20, 1989
Ron Edmonds/AP Photo
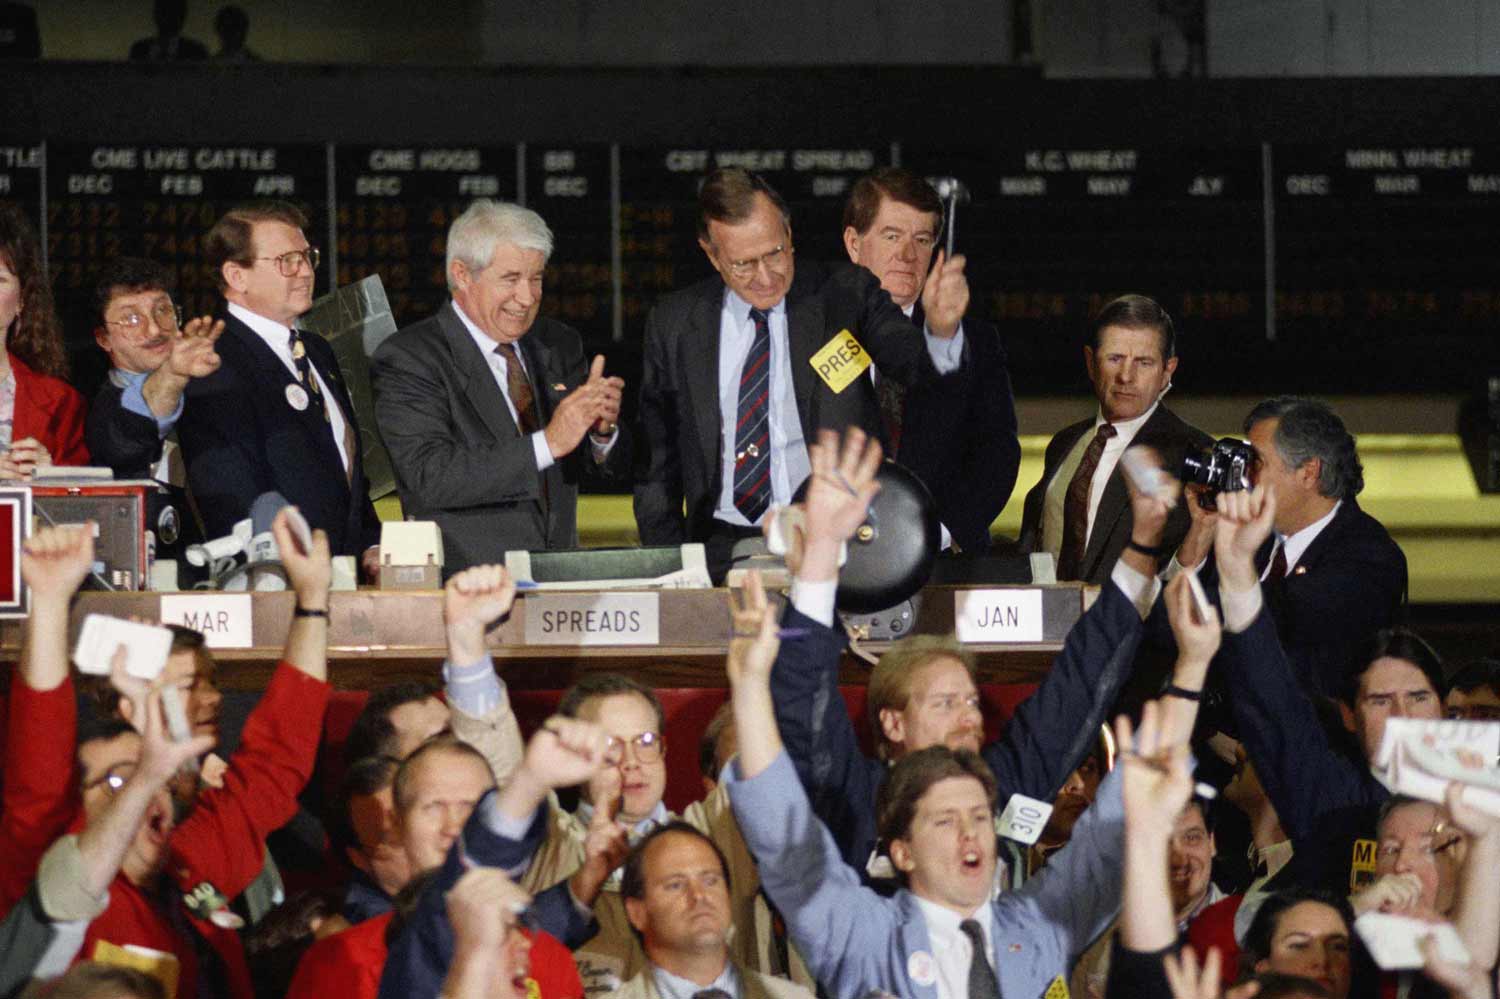
George H.W. Bush
The economy and stock market surged in President George H. W. Bush’s first year in office. The S&P 500 climbed 27% in 1989.
But then the savings-and-loan crisis and Gulf War struck. Oil prices more than doubled after Iraq invaded Kuwait. Growth slowed, and the American economy slipped into a mild recession in July 1990.
While the recession ended in March 1991, the recovery was choppy. Two years later, unemployment remained around 7%. The sluggish economy led to Bush’s defeat in 1992.
1st term
+51%
Jan. 20, 1989 – Jan. 20, 1993
Reuters
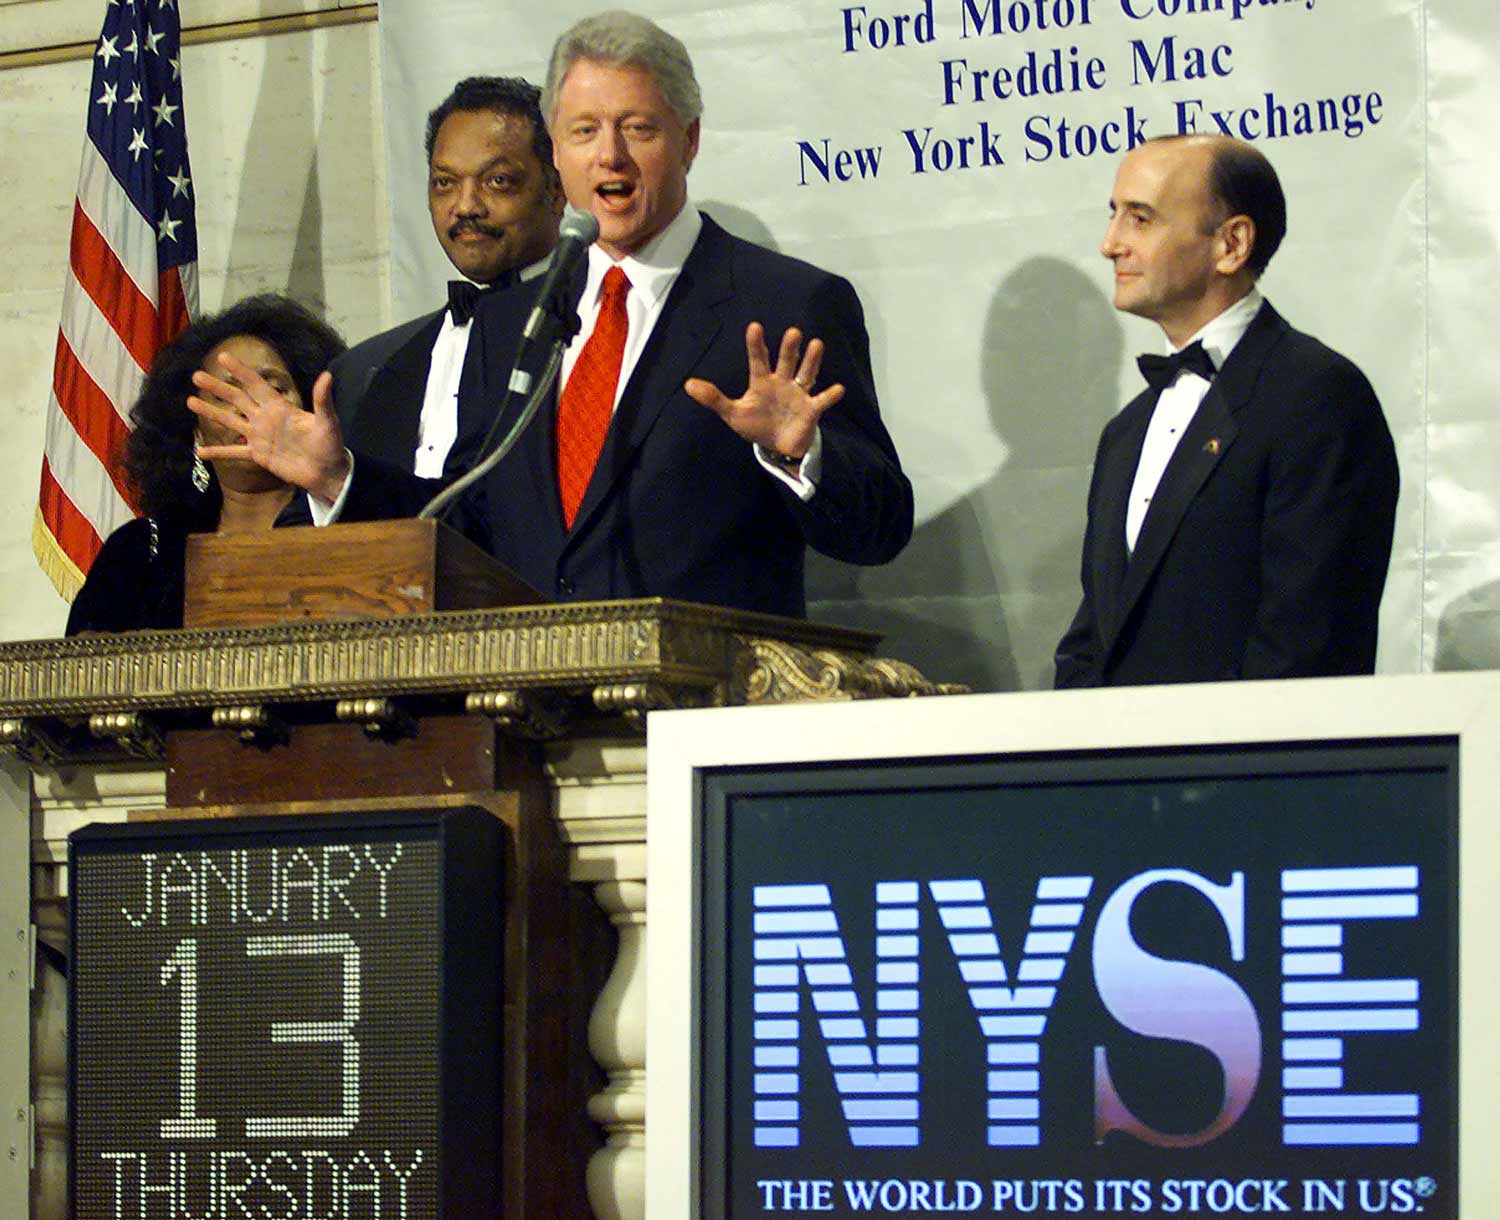
Bill Clinton
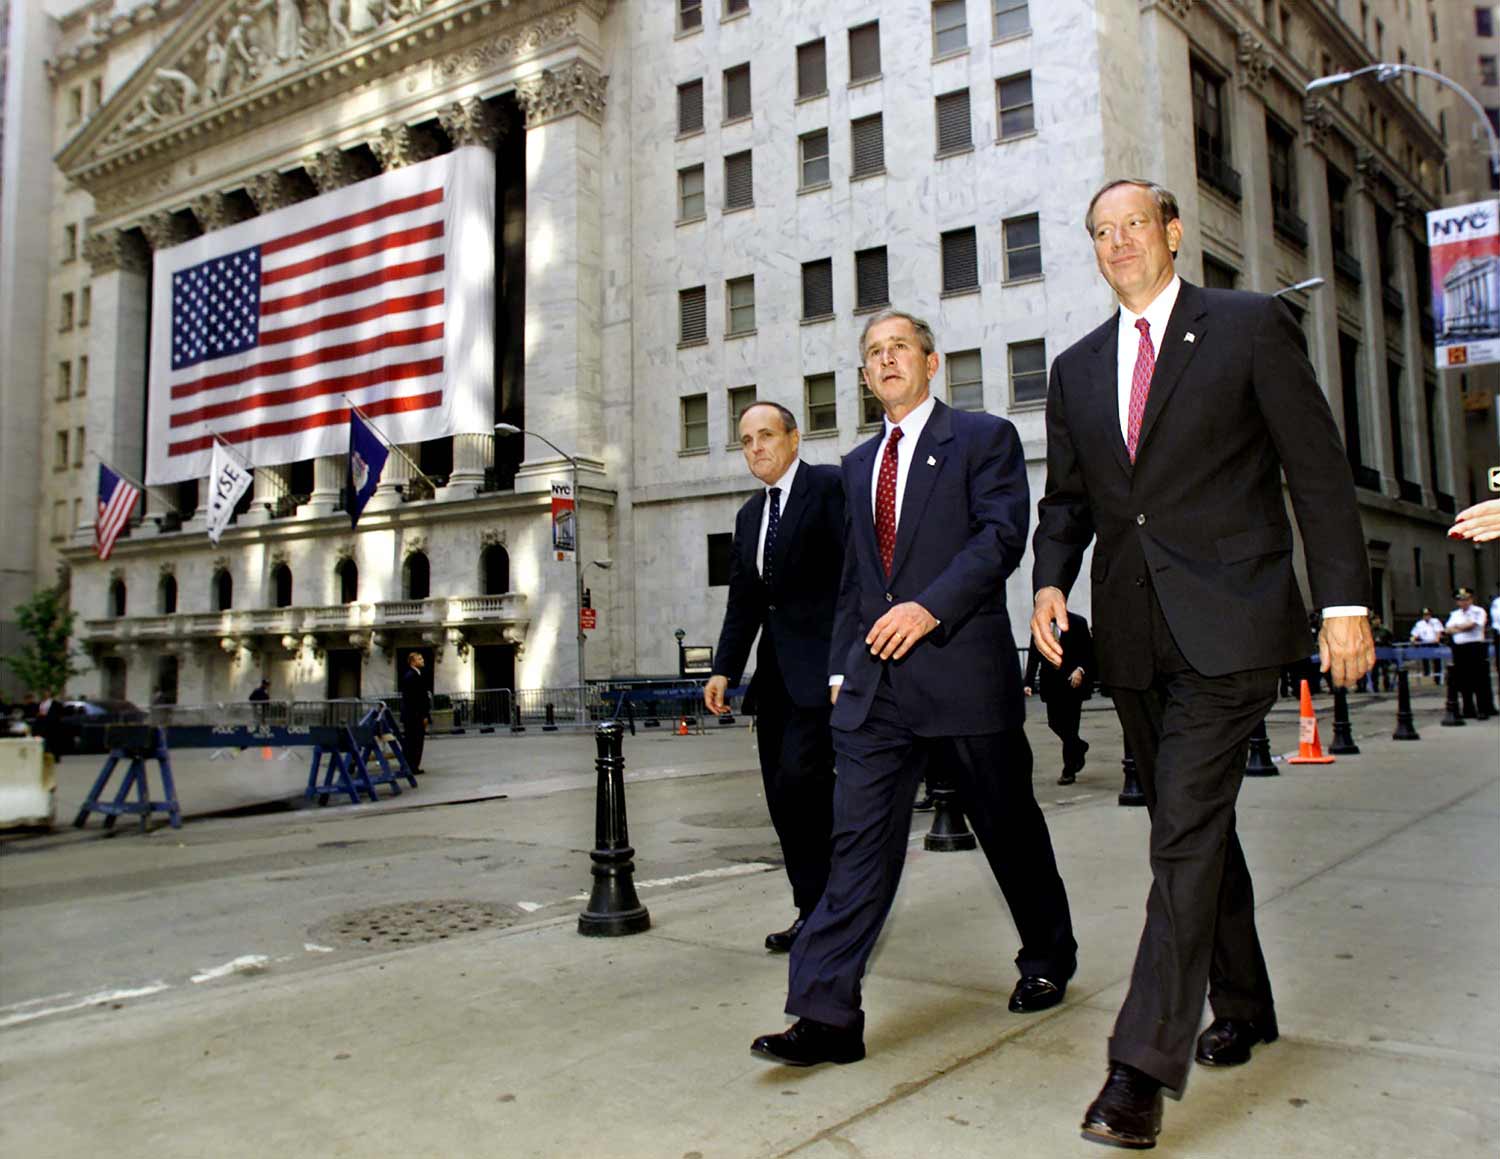
The roaring 1990s were very kind to Wall Street.
Stocks spiked — the S&P 500 increased 210% under President Bill Clinton — as investors celebrated the rise of the Internet and brisk economic growth. Clinton presided over two of the S&P 500’s top 10 years: 1995 and 1997.
GDP topped 4% in five of Clinton’s eight years in the White House. Inflation remained stable. Unemployment dipped below 4%. And the United States enjoyed the longest period of uninterrupted economic growth in modern history.
The era was punctuated by the dotcom boom, which amounted to the creation of an entirely new industry. The Nasdaq spiked sevenfold between 1993 and its peak in early 2000. The mania created vast amounts of wealth — much of which would disappear as the bubble inevitably popped.
1st term
+79%
Jan. 20, 1993 – Jan. 20, 1997
2nd term
+73%
Jan. 20, 1997 – Jan. 20, 2001
J. Scott Applewhite/AP Photo
George W. Bush
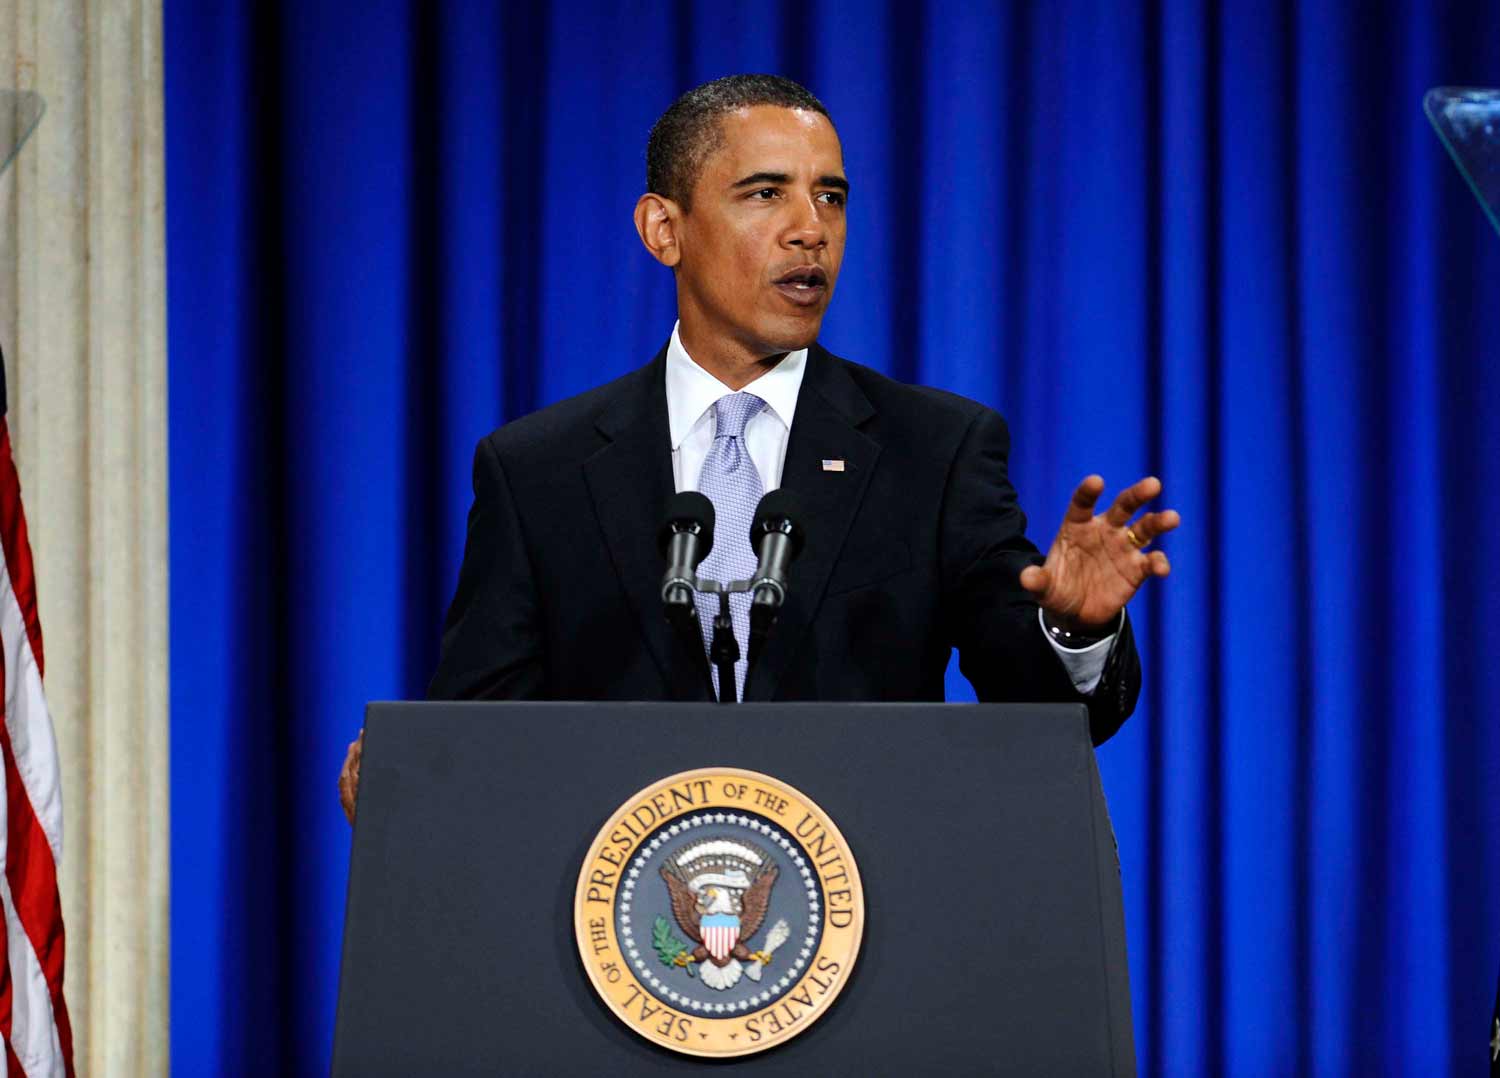
Investors who bet that a businessman in the White House would translate into strong returns were badly disappointed during President George W. Bush’s presidency.
The S&P 500 declined 40% under Bush, the worst among modern administrations.
Bush inherited the dotcom bust, which spawned the 2001 recession. The downturn was deepened by the 9/11 terror attacks.
Growth gathered steam in 2004 and 2005, fueled in part by low interest rates and the housing boom. But that bubble also popped in spectacular fashion, ushering in the Great Recession and the scariest financial crisis in a generation.
In the final quarter of Bush’s tenure, GDP plummeted at an 8.4% annual rate. Unemployment began rising rapidly. The S&P 500 plummeted 38% in 2008, its worst year since the Great Depression.
1st term
-12%
Jan. 20, 2001 – Jan. 20, 2005
2nd term
-31%
Jan. 20, 2005 – Jan. 20, 2009
Jeff Zelevansky/Reuters
Barack Obama
The Wall Street meltdown continued during the first few months of President Barack Obama’s presidency.
The financial and auto industries teetered on the brink of collapse before government bailouts saved them both. Unemployment would peak at 10% in 2009, doubling in barely a year.
The stock market bottomed out in March 2009, but then the economy slowly healed, beginning what would eventually become the longest bull market in American history.
Digging out of the depths of the Great Recession was a long and slow process, though. Annual GDP growth never topped 3% in the Obama era.
Hoping to juice the economy, the Fed kept pumping easy money into the system. The unprecedented experiment helped send stocks soaring — the S&P 500 nearly tripled during the Obama era — but also contributed to wealth inequality and populism.
1st term
+85%
Jan. 20, 2009 – Jan. 20, 2013
2nd term
+53%
Jan. 20, 2013 – Jan. 20, 2017
Mandel Ngan/AFP/Getty Images
Donald Trump
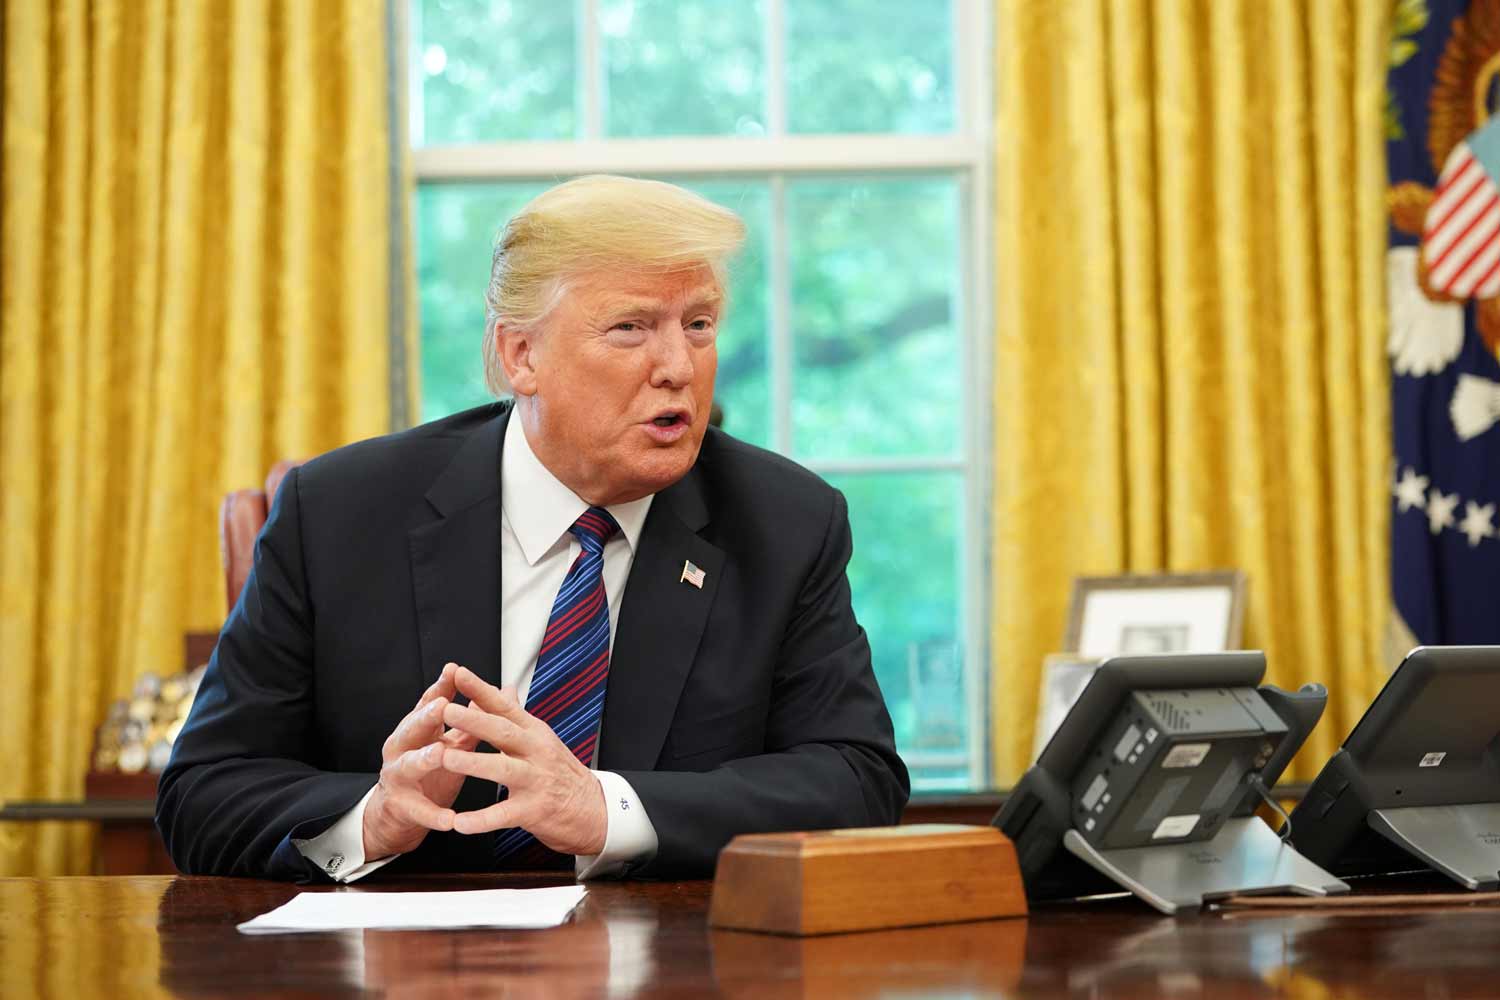
President Donald Trump’s upset victory initially fueled a breathtaking rally in the stock market as investors welcomed his pro-business agenda of tax cuts, deregulation and infrastructure spending. Early in Trump’s presidency, corporate profits spiked after his signature legislative achievement — a tax overhaul. And the unemployment rate plunged below 4%.
A trade war with China temporarily sucked some of the air out of the market’s gains in late 2018, but it wasn’t until the coronavirus pandemic hit the United States in early 2020 that the bull market officially came to an end.
The S&P 500 reached a high on February 19, 2020 and then plunged 34% over a month, as states enacted stay-at-home orders and businesses shut down to contain the virus.
Months later, stocks have bounced back even as the country is still struggling to recover. More than 24 million coronavirus cases have been identified in the US, and 400,000 Americans have died. Meanwhile, economic activity remains well below its pre-pandemic level, and millions of Americans continue to grapple with unemployment, hunger and struggle to pay their bills.
Cumulatively, the S&P 500 gained 67% from Trump’s inauguration to the market close on Tuesday, January 19, 2021 — his last full day in office.
Current term
null
Jan. 20, 2017 – Jan. 19, 2021
You may also like
-
Afghanistan: Civilian casualties hit record high amid US withdrawal, UN says
-
How Taiwan is trying to defend against a cyber ‘World War III’
-
Pandemic travel news this week: Quarantine escapes and airplane disguises
-
Why would anyone trust Brexit Britain again?
-
Black fungus: A second crisis is killing survivors of India’s worst Covid wave

